By clicking on the incident (using the incident highlighted in Figure 9.43 as an example), you’re taken to the Attack story tab of the incident, shown in Figure 9.44:
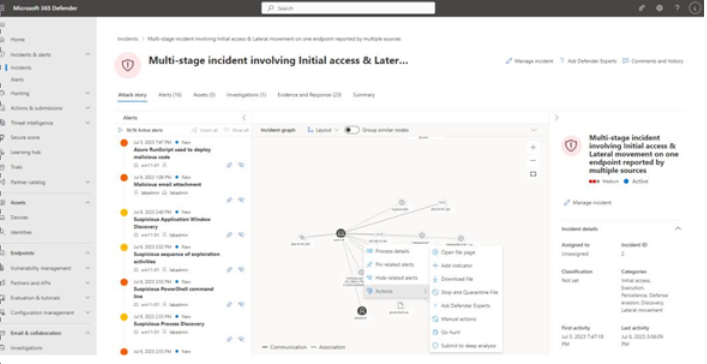
Figure 9.44 – Attack story
From here, you can pivot on any item, be it an individual alert in the Alerts pane, an item displayed in the Incident graph pane, or any of the tabs (Alerts, Assets, Investigations, Evidence and Response, or Summary). The attack story’s incident graph automatically groups similar items and nodes together, but you can slide the toggle to off to display each item node on its own (as it is inFigure 9.44). This may help you further see interactions between events.
Each item will display relevant details and contextual actions that you can take, such as listing out the URL details that a malicious process attempted to contact or seeing the code that was executed inside of a script.
Clicking an item in the Alerts pane will cause the details pane to focus on that item in the incident graph and show the other corresponding events that were happening in the chain. For example, by clicking on the Suspicious behavior by Microsoft Word was observeditem in the Alerts pane (see Figure 9.45), the attack story pivoted to show the user identity and device highlighted in the incident graph and the process tree, including the application lineage and command line that generated the alert.
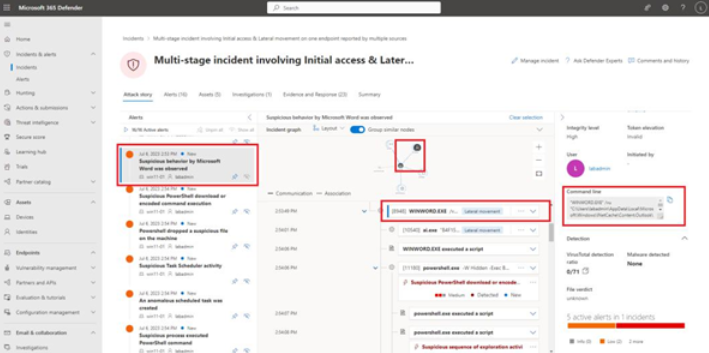
Figure 9.45 – Viewing an alert’s details
Clicking on the WINDWORD.EXE executable, as shown in Figure 9.45, brings up details in the far-right pane, including the process ID, the exact command line that was invoked, publishing details of the file, and more. You can further investigate items in the process tree, looking for any other clues that might aid your investigation.
Alerts
Switching to the Alerts tab shows all of the alerts related to an incident. Again, you can select an individual alert to see additional details about the alert. Depending on the type of alert, you may see details about a file, an IP address contacted, a device, or processes. You can edit the classification of the alert state (setting it to New, In progress, or Resolved), assign the alert to an individual for triage or investigation, set a classification, as well as provide a comment. See Figure 9.46:
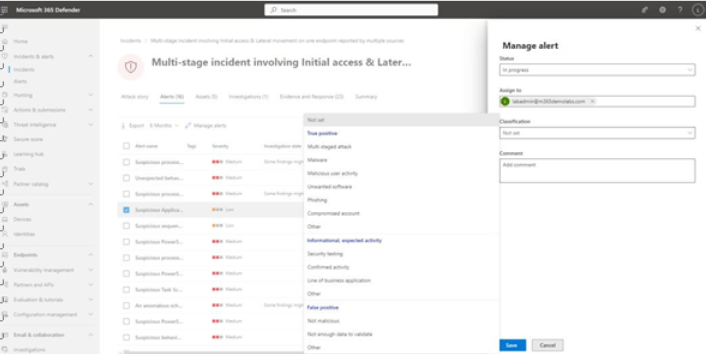
Figure 9.46 – Manage alert details
Alert classification helps your team identify genuine risks. For example, you may have hired a penetration testing firm to assess the security of your organizational processes and tools. When an alert is generated, you might classify that particular alert as Informational expected activity | Security testing. That informs others in the organization how they should respond to an alert.
After you have begun classifying alerts, the Recommendations tab on the Alert details flyout will start to provide additional insights about threats in your organization, such as whether this type of alert has been marked or classified before.
Assets
The Assets tab of an incident shows all of the organizational assets that are affected. This could include Devices, Users, Mailboxes, and Apps. Selecting an asset category will display all of the affected items in that category that have been associated with the current incident. Selecting an individual item will take you to its associated asset page (such as the Assets page for devices and users or Threat Explorer for mailboxes).